

News & Advice


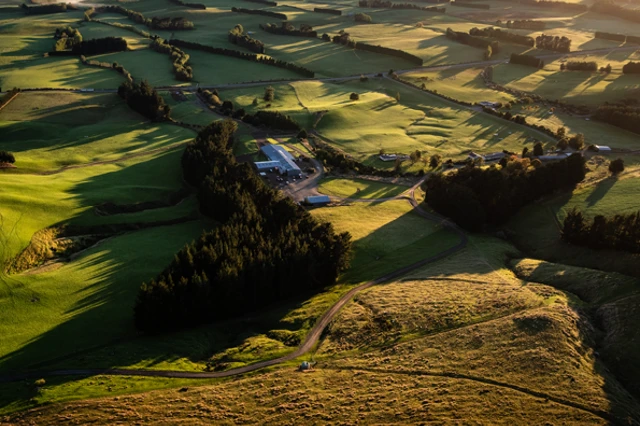
News
15 June 2026
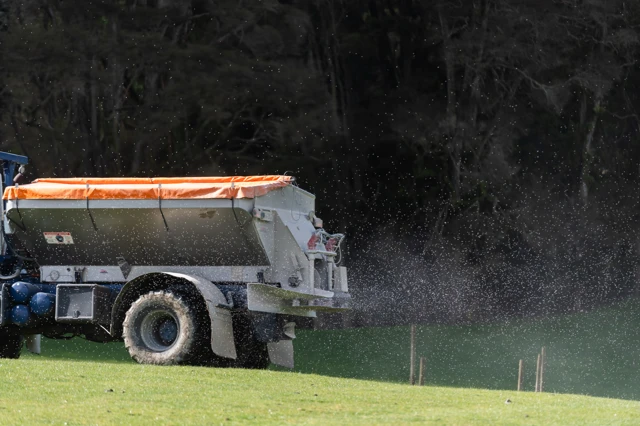
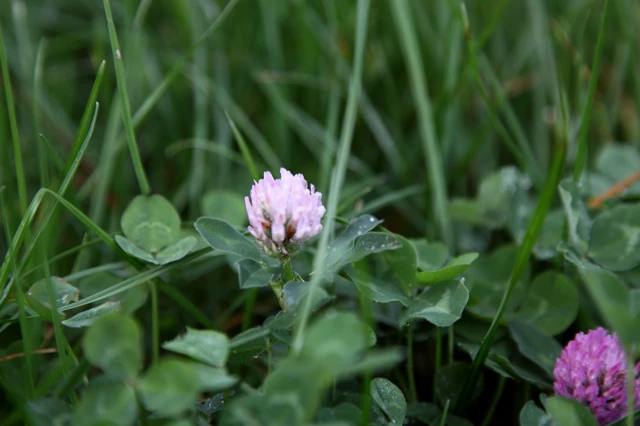
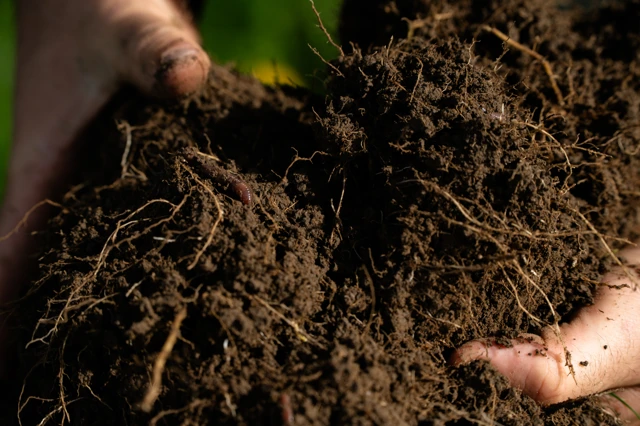
Sulphur remains fundamental to pasture and crop performance in New Zealand farming systems

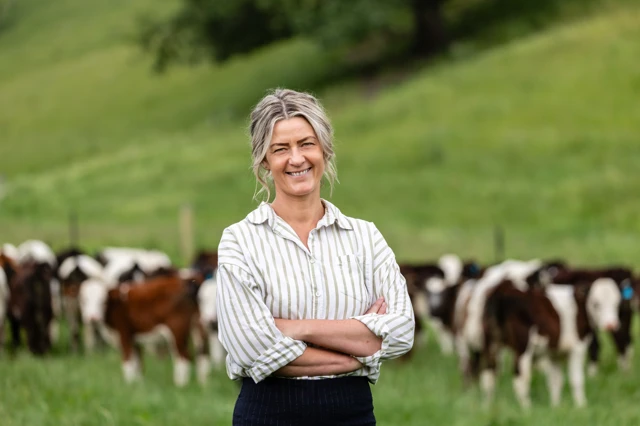
News
15 June 2026
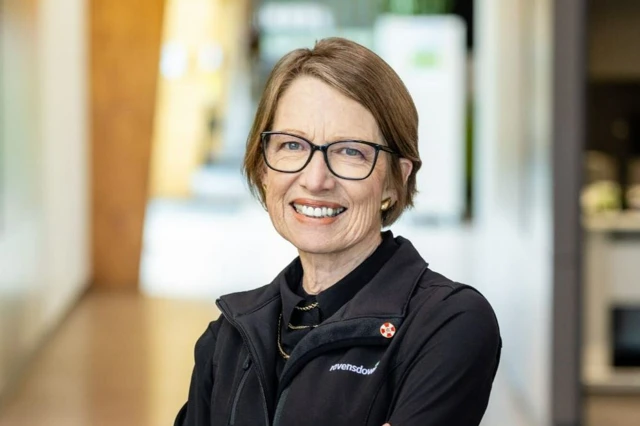
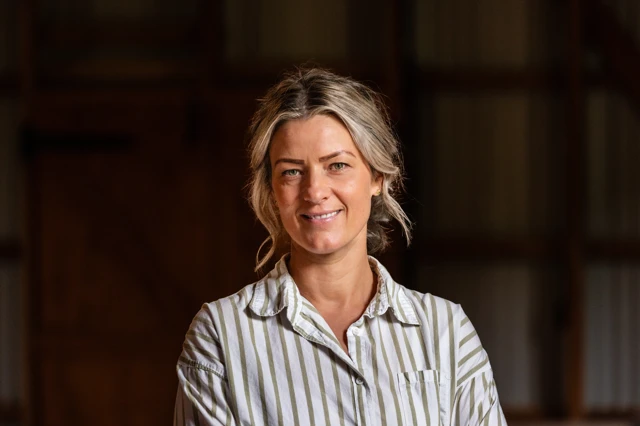
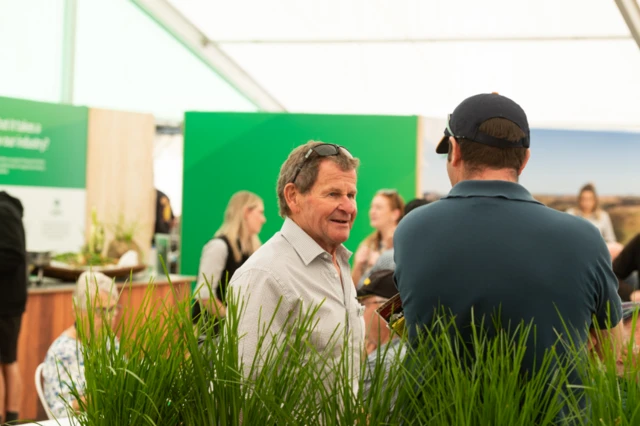
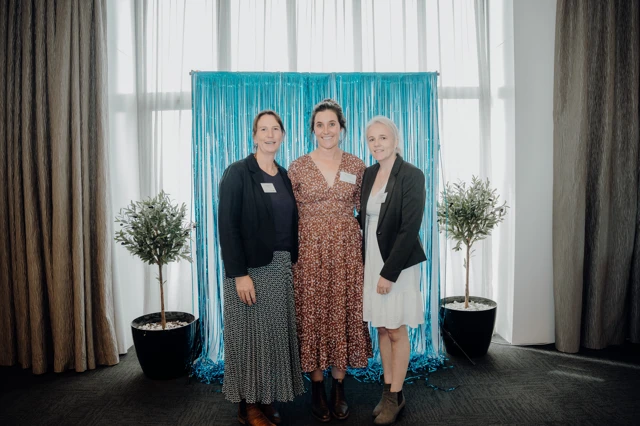
Jane Smith on harnessing passion to shape a stronger future ahead of 2026 Director Elections
![Ravensdown's Winter 2026 Market Outlook [Thumbnail]](/media/5mtkm535/ravensdowns-winter-2026-market-outlook-thumbnail.jpg?width=640&height=426&format=webp&quality=90&v=1dcf6dc344b7270)
Reports
08 June 2026
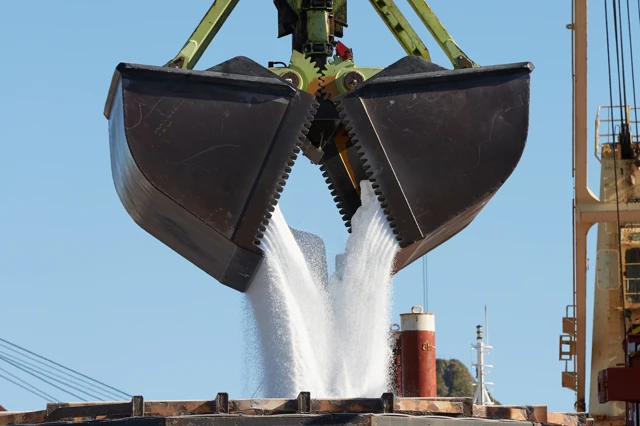
Market Outlook Winter 2026

News
17 April 2026
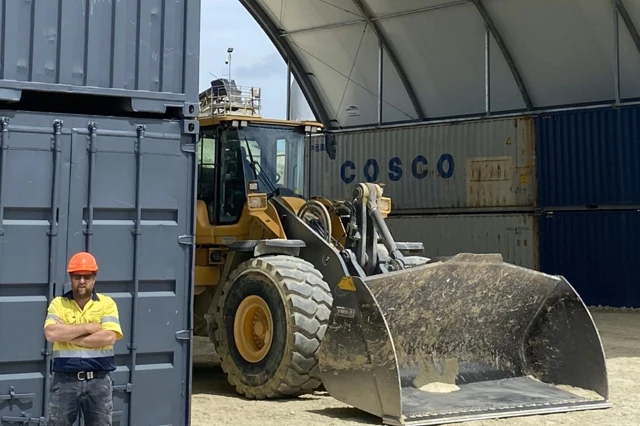
Rolling in Ravensdown’s first electric loader: quietly saving loads and fulfilling environmental commitments

News
13 April 2026
To support supply and price certainty we have asked customers to order normally.

Reports
04 March 2026
Market Outlook Autumn 2026

News
09 February 2026
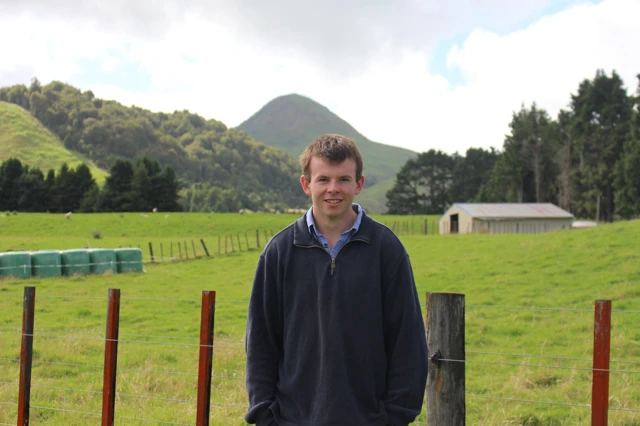
Young arable farmer recognised with Ravensdown scholarship

News
15 December 2025
Two Rural Icons, One Shared Paddock: Ravensdown Partners with Footrot Flats
![Market Outlook Summer 2026 [Thumbnail Squared] (1)](/media/asjpyowg/market-outlook-summer-2026-thumbnail-squared-1.png?width=640&height=426&format=webp&quality=90&v=1dc6a1838d450b0)
Reports
11 December 2025
Market Outlook Summer 2026

News
05 December 2025
Christmas store hours

News
25 November 2025
Applications open for 2026 Hugh Williams Memorial Scholarship

News
12 November 2025
Superphosphate stands the test of time

News
28 October 2025
Our stores are open for business

Governance
23 September 2025
Ravensdown South Island shareholders have voted Jane Smith to the Ravensdown Board for a three-year term.

19 September 2025
Market Outlook Spring 2025

12 August 2025
Director Elections 2025 – South Island Area election
News
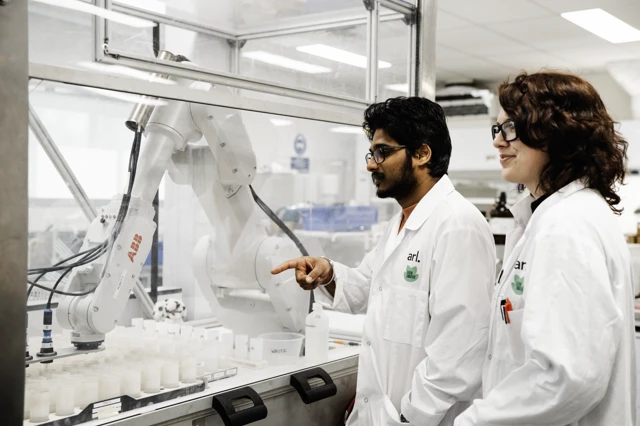
05 August 2025
Robotic Rolleston Lab will Boost Farm Soil Testing

News
31 July 2025
Ravensdown 2025 financial results

Governance
28 July 2025
Board of Directors Election 2025
News
23 June 2025
Kate Faulks reflects on her path to the Ravensdown Board ahead of 2025 Director Elections
Expertise
23 June 2025
Core Governance attributes for a Ravensdown director

News
09 June 2025
HawkEyePro Launch
Expertise
04 June 2025
Market Outlook Winter 2025
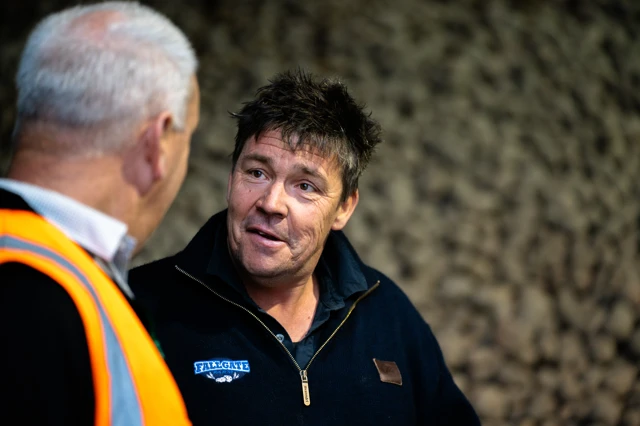
News
03 June 2025
Friends of Ravensdown - Fallgate Farms

News
26 May 2025
Where Are They Now? – Ravensdown Hugh Williams Memorial Scholarship
Events
15 May 2025
Young Farmer Grand Final
Events
12 May 2025
Lawrence Lions Club Winter Crop Competition
Research & Innovation
01 May 2025
Fonterra invests in EcoPond pilot to reduce on-farm emissions

Events
01 May 2025
Fieldays
News
23 April 2025
Where Are They Now? – Ravensdown Hugh Williams Memorial Scholarship

News
01 April 2025
Where Are They Now? – Ravensdown Hugh Williams Memorial Scholarship
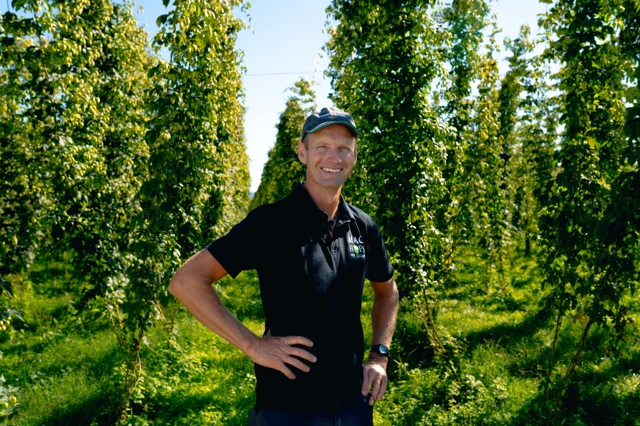
Publications
12 March 2025
Friends of Ravensdown: Mac Hops

News
06 March 2025
Where Are They Now? – Ravensdown Hugh Williams Memorial Scholarship
News
05 March 2025
Lifting the lid on governance
News
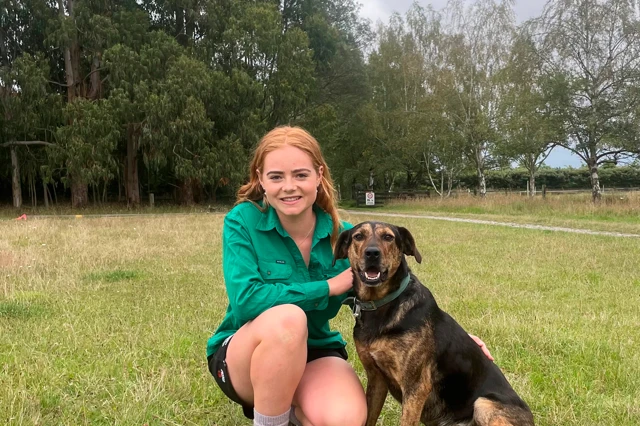
20 February 2025
Where Are They Now? – Ravensdown Hugh Williams Memorial Scholarship - Georgia Higinbottom
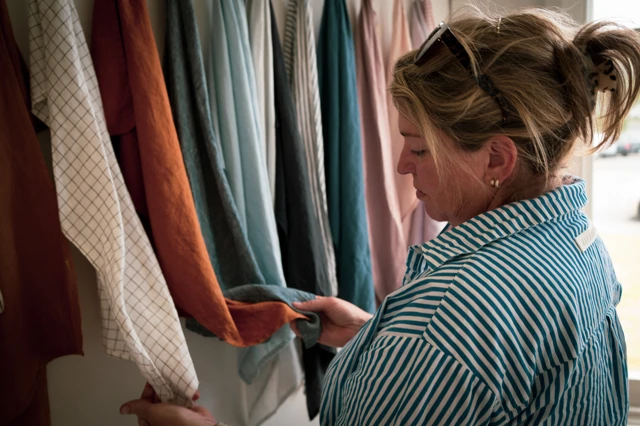
News
03 February 2025
Friends of Ravensdown: Foxtrot Home

News
29 January 2025
Scholarship winner ready to get scientific with farming
News
13 December 2024
Friends of Ravensdown: Floating Peaks

News
07 December 2024
Adapting with nature at Tākaka Hill
News
01 November 2024
Gearing up for Freshwater Farm Plans
News
23 September 2024
Kate Faulks elected to the Ravensdown Board
News
09 August 2024
Ravensdown delivers solid financial performance in challenging environment
News
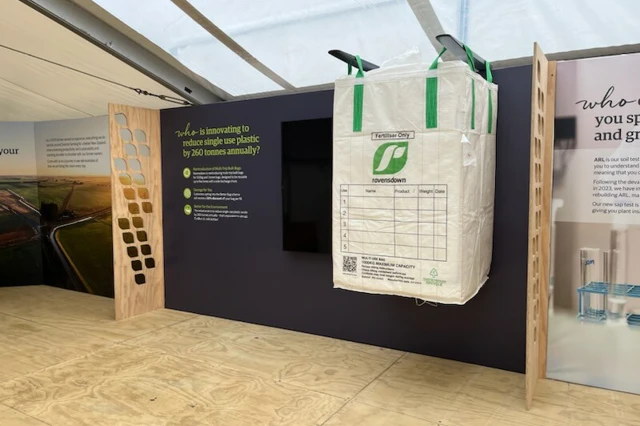
27 June 2024
Better Bags
News
31 May 2024
Harald Hendel appointed Aerowork CEO

News
29 May 2024
Graham Stuart appointed to Ravensdown Board
Expertise
23 May 2024
Dealing with drought conditions
Expertise
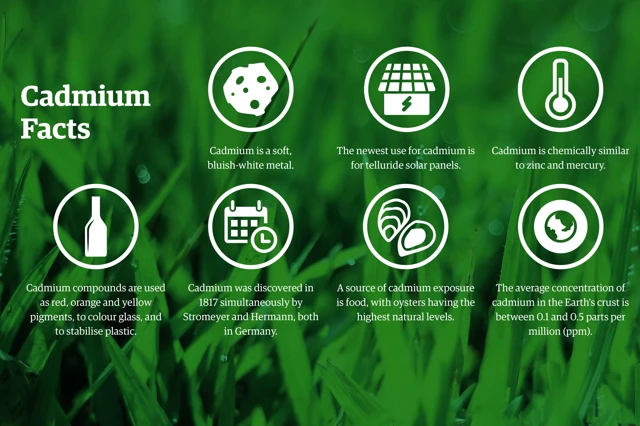
16 May 2024
Cadmium: The facts
News
24 April 2024
Share up for maximum benefit
News
02 April 2024
2024 Director Elections
News
14 February 2024
‘Scary’ floods inspire scholarship winner to improve rural climate resilience
News
30 January 2024
Ravensdown Rocks with Shed Solution
Expertise
14 December 2023
Testing method unlocks healthy soil
News
14 November 2023
Ravensdown’s Agri-Women take it to the Next Level
News
25 July 2023
Ravensdown is reducing its greenhouse gas emissions with low-carbon urea
News
19 June 2023
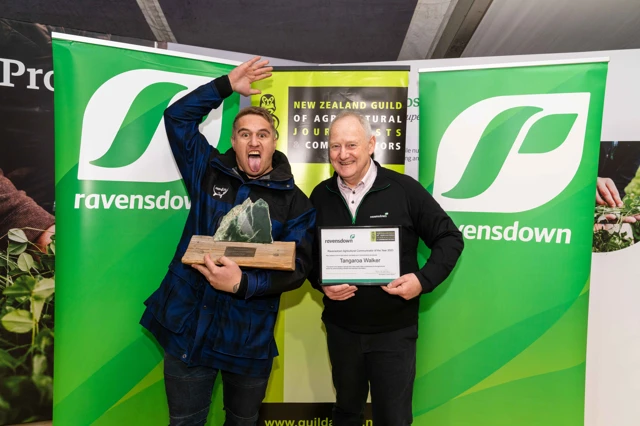
Tangaroa Walker named Ravensdown Agricultural Communicator of the Year 2023
Expertise
13 June 2023
Trends pointing to productivity risk for New Zealand
News
05 April 2023
JV makes debut investment in emissions reduction tech

News
03 April 2023
New Ravensdown tech helps farmers map and respond to slip damage
27 March 2023
Fertiliser Association launches revised Code of Practice

News
22 March 2023
Ravensbourne Wharf upgrade completed
03 March 2023
Cyclone recovery for farmers
Expertise
03 February 2023
New 10 in 7 milking regime shows benefit for staff
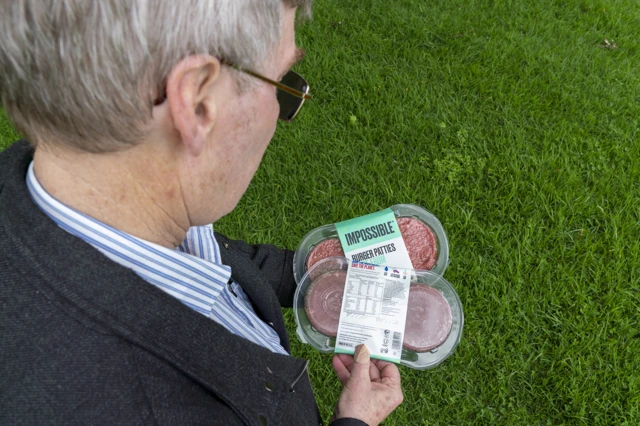
Research & Innovation
03 February 2023
Genetically modified crops - do we need a rethink?
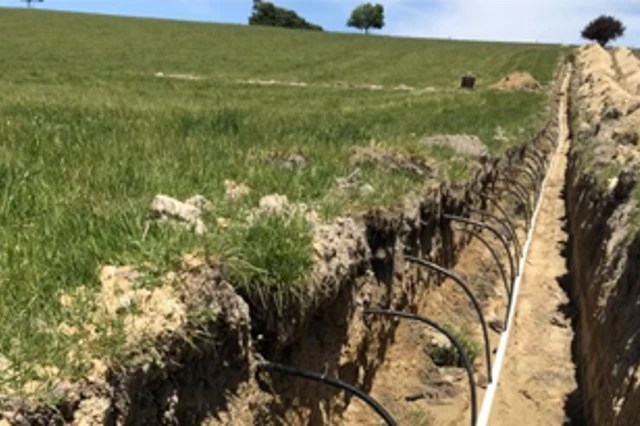
03 February 2023
Sub-surface irrigation helps improve water-use efficiency
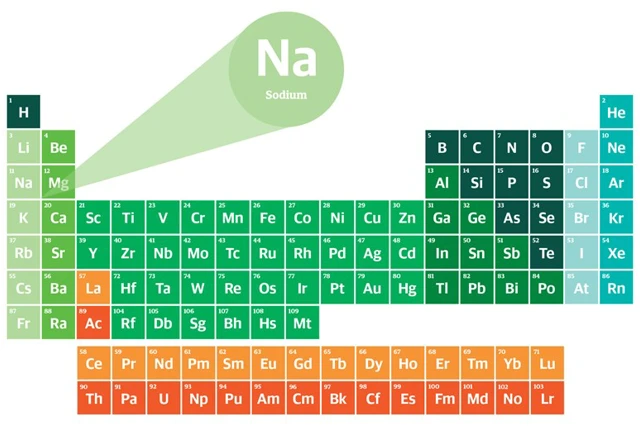
02 February 2023
Elementary essentials 7: Sodium
31 January 2023
Bridging the gap between science and farming
Expertise
01 October 2022
Elementary essentials 6: Calcium
Expertise
09 August 2022
The importance of having legume in your permanent pasture
08 July 2022
Animal Welfare Considerations
Expertise
09 February 2022
Is Molybdenum deficiency holding your clover back?
News
07 February 2022
New EcoPond tool a game changer for methane emissions
Expertise
07 February 2022
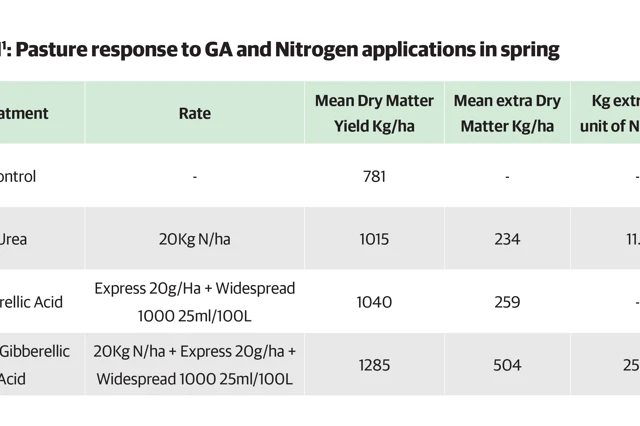
A formidable combo: Liquid N and gibberellic acid

Expertise
07 February 2022
New tool to measure soil mineralisable nitrogen
Expertise
27 September 2021
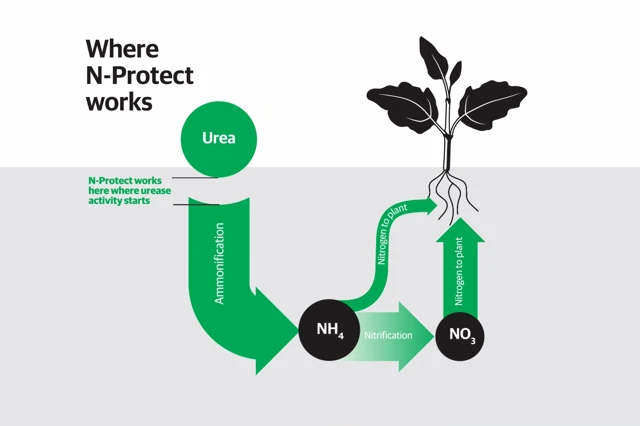
N-Protect – the smart choice in coated urea
Expertise
16 September 2021
Elementary essentials 5: Magnesium

19 August 2021
Ready. Select. Grow. Nitrophoska Select
Expertise
09 August 2021
Elementary essentials 4: Sulphur
Expertise
09 August 2021
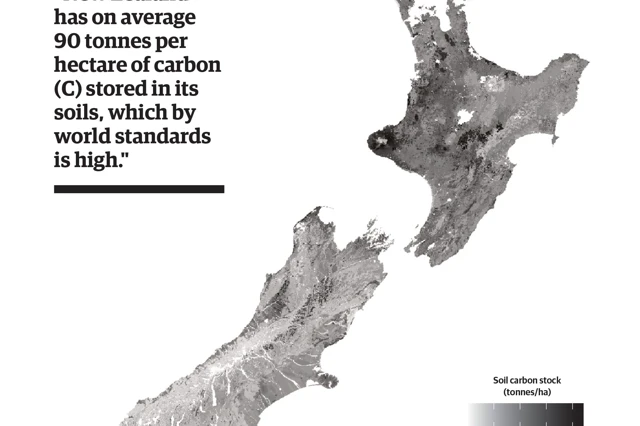
New Zealand’s carbon soil stocks: what do we know?
Expertise
01 July 2021
Elementary essentials 3: Potassium
Expertise
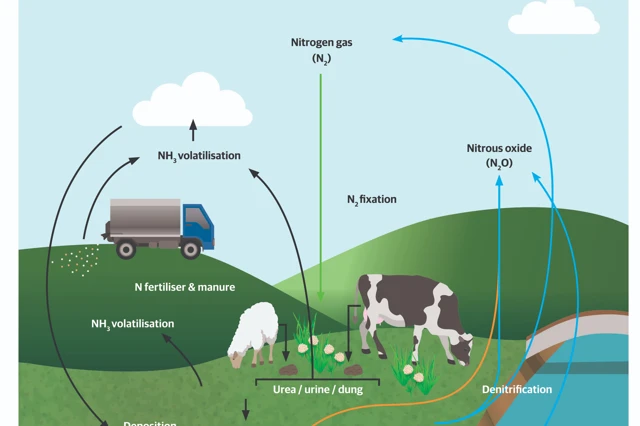
01 June 2021
Elementary essentials #1: Nitrogen (N)
11 May 2021
Superphosphate ideal for spring spreading
Expertise
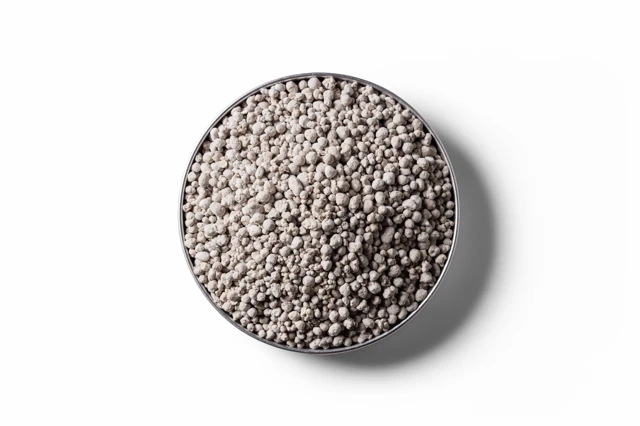
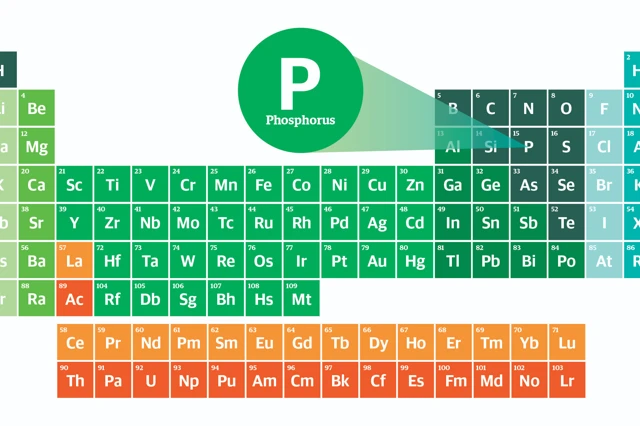
04 May 2021
Elementary essentials 2: Phosphorus
Expertise
15 February 2021
Don’t run fast to stand still
Expertise
18 October 2020
Beating the insect pests in forage brassica crops
Expertise
05 August 2020
Superphosphate – phosphate with benefits
Expertise
05 August 2020
Liquid nitrogen as an option
Expertise
26 May 2020
Winter Maintenance important for quality and persistence of Lucerne
Expertise
18 July 2019
Shining the spotlight on potash
Expertise
27 November 2017
Determining the right selenium levels for livestock